History offers powerful lessons about how financial markets and the
broader economy behave under stress. The following case studies
highlight major events that shaped recent economic history and
provide context for concepts you’ll encounter elsewhere on this
site.
The 2008–09 Financial Crisis
In the years leading up to 2007, home prices in the United States
more than doubled as low interest rates and new mortgage products
made borrowing easy. Lenders extended credit to many
borrowers with weak credit histories, and these subprime
mortgages were bundled into complex securities sold around the
world. When housing prices peaked in 2006 and began to fall,
defaults on mortgage loans jumped. Financial institutions
holding mortgage‑backed securities suffered heavy losses, and
credit markets seized as investors lost confidence. Several
large investment banks either failed or required emergency
bailouts. The U.S. economy entered a deep recession known as
the “Great Recession,” and unemployment rose sharply. The
Federal Reserve responded with unprecedented actions to provide
liquidity and cut interest rates to near zero, while Congress
passed major reforms to strengthen financial regulation. The
recovery began in mid‑2009 but was the slowest in decades, and
the crisis reshaped global banking and regulatory policy.
The 2020 COVID‑19 Recession
In March 2020, the outbreak of COVID‑19 and stay‑at‑home
restrictions triggered the sharpest economic contraction on
record. Businesses closed and consumers stayed home, causing
a sudden collapse in spending. The unemployment rate in the
United States jumped to 14.7 percent in April 2020, while real
GDP per capita fell at an annualized rate of nearly 25 percent.
Unlike the Great Recession, there was nothing fundamentally
wrong with the economy; it was a public health crisis that
forced production to halt. The Federal Reserve slashed
interest rates, launched emergency lending programs and
supported credit markets. Congress passed multiple stimulus
packages to help households and businesses. Once vaccines
rolled out and restrictions eased, economic activity rebounded
quickly, although the recovery has been uneven across sectors.
The 2021–22 Inflation Surge
After the pandemic recession, prices began rising rapidly as
supply chains struggled to keep up with surging demand.
Disruptions at ports, factories and logistics providers
created shortages and backlogs of goods, particularly cars and
consumer electronics. Energy prices swung wildly, with oil
and natural gas costs soaring as economies reopened and
geopolitical tensions disrupted supply. At the same time, the
U.S. labor market tightened; job openings far exceeded the
number of unemployed workers, pushing wages higher. Economists
identified three main drivers of post‑2020 inflation: volatile
energy prices, supply‑chain bottlenecks and elevated
automobile prices. These factors pushed headline inflation
well above the Federal Reserve’s 2 percent target in 2021 and
2022. While some price pressures have eased, the episode
underscored how both demand and supply shocks can feed
inflation.
Federal Reserve Rate Hikes (2022–23)
To bring inflation back toward its 2 percent goal, the Federal
Open Market Committee (FOMC) embarked on its most aggressive
tightening cycle in decades. Beginning in March 2022, the
FOMC raised the target range for the federal funds rate at
every meeting through May 2023. The first hike was a modest
0.25‑percentage‑point increase, but subsequent moves were
larger—four straight 0.75‑point increases in June, July,
September and November 2022. By June 2023 the target range
reached 5 to 5¼ percent, the highest in years. Policymakers
acted quickly because inflation was persistently elevated and
the labor market remained very tight, and they sought to
demonstrate their commitment to price stability. After mid‑
2023 the pace of increases slowed as the cumulative effects of
earlier hikes and banking stress began to restrain activity.
The Student Loan Debt Burden
Higher education in the United States is increasingly financed
through loans. As of early 2026, Americans owed roughly
$1.8 trillion in student loans. Federal loans accounted for
about 91 percent of this debt, with private loans making up
the rest. More than 42 million people hold federal student
loan debt, and the average balance is close to $40,000. Many
borrowers incur even larger balances for graduate and
professional degrees. Rising tuition costs and slow wage
growth mean that paying down student debt can take years.
Policymakers debate how best to address this burden, with
proposals ranging from enhanced loan forgiveness to expanded
grant aid and tuition reforms. For students, it’s crucial to
borrow only what is necessary and to understand the long‑term
implications of taking on large debts.
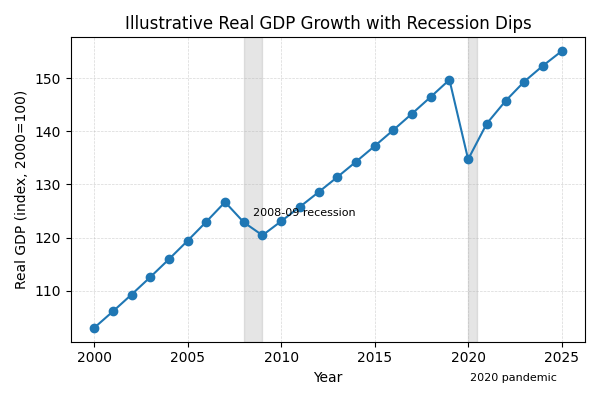
Visualizing Economic Shocks
The chart below illustrates how real gross domestic product
(GDP) growth has fluctuated over the past two decades. Notice
the sharp contraction during the 2008–09 financial crisis and
the even steeper drop in 2020 when the pandemic hit. Such
visuals help connect economic theory with real outcomes.